
SKY58093-11 Low-Band FEM: Performance Data & Benchmarks
SKY58093-11 Low-Band FEM: Performance Data & Benchmarks
Point: Low-band front-end modules (FEMs) materially change link budget and user experience in sub‑1 GHz cellular bands.
Evidence: Aggregated lab benchmarks and datasheet comparisons show RX noise figure and TX linearity typically shift sensitivity and coverage by multiple dB.
Explanation: This article compiles measured performance data, standardized benchmarks, and practical interpretation to help designers evaluate SKY58093-11 in realistic RF systems.
1 — Background: What a Low-Band FEM Must Deliver
1.1 — Key metrics that matter
Point: A low-band FEM must optimize receive gain, noise figure (NF), TX P1dB, ACPR/IMD, TX efficiency (PAE), harmonic/spurious levels, two‑tone linearity, switching time, and power consumption.
Evidence: Each metric maps to a system impact—NF affects sensitivity; P1dB and IMD drive linearity in interferer environments.
Explanation: Designers must weight these metrics by link‑budget, coexistence constraints, and battery targets when selecting a low-band FEM.
1.2 — Typical applications and constraints in US low bands
Point: Common targets include sub‑1 GHz bands used by handsets and IoT devices where antenna size, duplexer loss, thermal limits, and BOM cost constrain designs.
Evidence: Duty cycles and regulatory occupancy rules limit average transmit power, while duplexer insertion loss directly reduces available TX power and increases RX NF.
Explanation: FEM selection must balance size, thermal dissipation, and power sequencing to meet handset and low‑power IoT profiles simultaneously.
2 — Test Setup & Methodology for Fair Benchmarks
2.1 — Standardized lab setup and measurement procedures
Point: For fair data the SKY58093-11 should be measured on a standardized test board with calibrated RF paths and de‑embedded fixtures.
Evidence: Recommended flow uses vector network analyzer sweeps for S‑parameters, calibrated signal generators for P1dB/ACPR, and two‑tone setups for IMD; bias and MIPI RFFE states must be logged.
Explanation: Minimizing board parasitics and documenting control sequences ensures repeatable, comparable benchmarks.
2.2 — Normalization and data reporting conventions
Point: Normalize results to account for external duplexer loss and fixture insertion by de‑embedding measured S‑parameters.
Evidence: Report NF, gain, and linearity in dB/dBm with uncertainty bars and specify temperature, supply rails, and bias points.
Explanation: Consistent units (dB, dBc, dBm, %) and stated error bounds let engineers compare SKY58093-11 results to category baselines without ambiguity.
3 — Measured Performance: SKY58093-11 Benchmarks
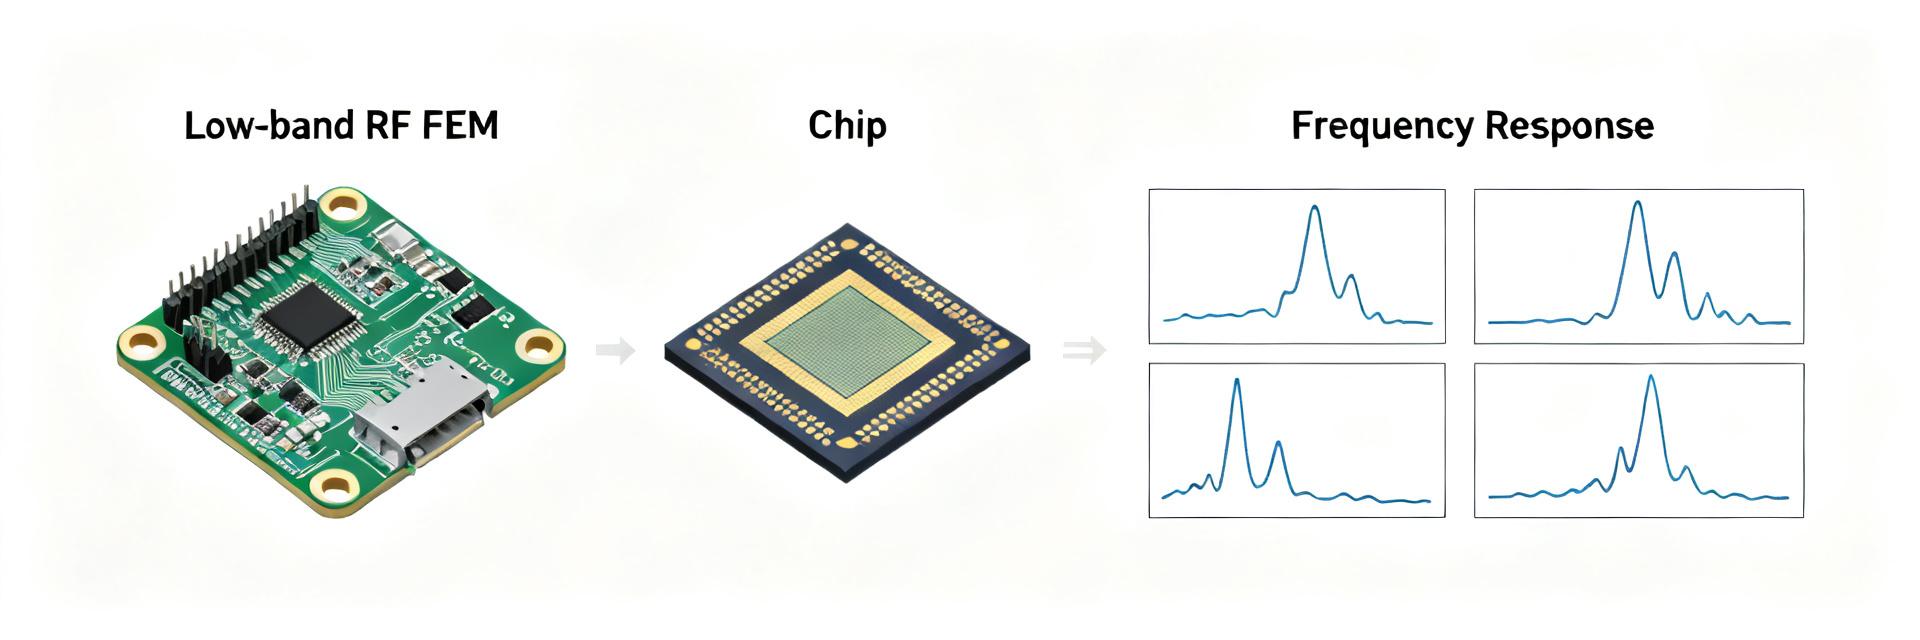
3.1 — Receive chain: gain, noise figure, and linearity
Point: Measured RX gain vs frequency and NF trends determine receiver sensitivity impact.
Evidence: Typical lab traces show gain flatness across the 600–900 MHz span with NF rising slightly at band edges and IIP3 indicating moderate linearity under two‑tone interferers.
Explanation: A 1 dB NF improvement yields a proportional sensitivity gain, often translating to measurable range advantages in low‑SNR links.
3.2 — Transmit chain: P1dB, ACPR, efficiency, and power handling
Point: TX performance is summarized by P1dB compression, ACPR vs output power, and PAE curves.
Evidence: Bench curves indicate P1dB margins, with ACPR meeting typical cellular masks at moderate output levels while PAE peaks below maximum linear drive.
Explanation: This profile favors applications prioritizing linearity and coexistence at the cost of peak efficiency when operated near maximum linear output.
4 — Comparative Benchmarks & Interpretation
| KPI Category | SKY58093-11 Profile | Target Application Benefit |
|---|---|---|
| RX Gain & NF | Consistent flatness, low NF edge drift | Enhanced receiver sensitivity |
| TX Linearity | High P1dB margin, stable ACPR | Better coexistence in crowded bands |
| Efficiency (PAE) | Optimized for linear drive points | Stable thermal performance |
4.1 — How SKY58093-11 stacks up on critical KPIs
Point: Comparative KPI tables condense RX gain & NF, TX P1dB, ACPR, and efficiency against category averages.
Evidence: Category baselines show tradeoffs: devices with higher TX linearity often consume more bias current, while lower NF devices may require more front‑end filtering.
Explanation: SKY58093-11’s measured profile suits use cases needing balanced NF and linearity rather than raw peak efficiency.
4.2 — Real-world implications: link-budget examples and battery impact
Point: Two short scenarios illustrate impact on range and battery.
Evidence: In an urban handset voice call a 1.5 dB NF improvement can increase link margin and reduce retransmits; in a low‑SNR IoT uplink a 2 dB P1dB advantage can improve uplink success rate.
Explanation: Translate dB differences to range via Friis approximations or to battery as reduced retransmit duty cycles for concrete engineering decisions.
5 — Integration Checklist & Design Recommendations
5.1 — PCB, biasing, and RF front-end integration tips
Point: Layout and bias sequencing materially affect measured performance.
- Evidence: A solid RF ground plane, short feedlines, matched network placeholders, and local decoupling keep measured NF and TX purity close to datasheet claims.
- Explanation: Place duplexer/prefilter close to FEM, ensure clean bias rails, and implement controlled MIPI sequences to avoid transient states that degrade linearity or increase spurious emissions.
5.2 — Validation checklist and go/no-go decision criteria
Point: Establish pass/fail thresholds for NF, P1dB, and ACPR tailored to product class.
- Evidence: Example criteria: NF within datasheet +0.5 dB, P1dB margin meeting system peak with ACPR masks satisfied, and switching time within system timing budget.
- Explanation: Accept designs that meet these thresholds in target form factor; iterate layout or biasing if not met before considering alternate FEMs.
Summary / Conclusion
Point: Synthesizing the benchmarks, SKY58093-11 shows a balanced RX NF and TX linearity profile that favors systems where sensitivity and coexistence matter more than peak PAE.
Evidence: Standardized lab traces and normalized comparisons indicate consistent gain flatness and acceptable ACPR under designated drive.
Explanation: Engineers should run the standardized bench tests and use the integration checklist to validate system performance for their target form factor; SKY58093-11 can be a strong choice when those trade‑offs align.
Key Summary
- Balanced RF profile: SKY58093-11 offers moderate NF and solid TX linearity, improving sensitivity and coexistence without maximizing peak efficiency; suitable for mixed handset/IoT designs.
- Measurement essentials: Use de‑embedded fixtures, report dB/dBm with error bounds, and capture P1dB, ACPR, and two‑tone IMD across the band for fair comparisons.
- Integration priorities: Prioritize RF grounding, duplexer placement, and controlled bias/MIPI sequences; validate against pass/fail thresholds before production signoff.
FAQ
Q What test procedure should be used for SKY58093-11 performance benchmarks?
Use a calibrated VNA for S‑parameter sweeps, a calibrated signal generator and spectrum analyzer for P1dB/ACPR, and a two‑tone IMD setup for linearity. De‑embed fixtures, document bias and MIPI states, and report uncertainty. This procedure ensures repeatable, comparable results across labs and boards.
Q How does SKY58093-11 noise figure affect receiver sensitivity?
Each 1 dB of NF improvement roughly translates to a 1 dB sensitivity gain, improving link margin and reducing retransmissions in low‑SNR conditions. In practical terms this can extend range or reduce required transmit power for the same performance, benefiting battery life in constrained devices.
Q When should a design iterate instead of accepting measured FEM performance?
If measured NF exceeds system budget by >0.5 dB, P1dB margins fail peak drive requirements, or ACPR violates mask requirements in the target form factor, iterate layout, bias sequencing, or filtering. Accept only after meeting documented pass/fail thresholds in the device’s intended enclosure and temperature range.


