
Diplexer: High-Power Dual-Band Full Specs & Test Data
Recent bench campaigns across multiple vendors show that high-power dual-band RF front-ends increasingly hinge on diplexer performance: insertion loss and isolation determine link margin, while power handling and thermal stability drive reliability. This article provides a concise, data-driven roadmap to reading full specs and validating dual-band units for US cellular base stations, fixed wireless, and backhaul deployments. It highlights measurable acceptance criteria and a repeatable bench methodology suitable for procurement and qualification.
Definition and scope:
A diplexer is a passive RF device that routes two frequency bands to a common port with minimal interaction; high-power, dual-band units are essential where transmit power, heat dissipation, and isolation directly impact system availability and regulatory compliance.
Technical Overview: What a High‑Power Dual‑Band Diplexer Is
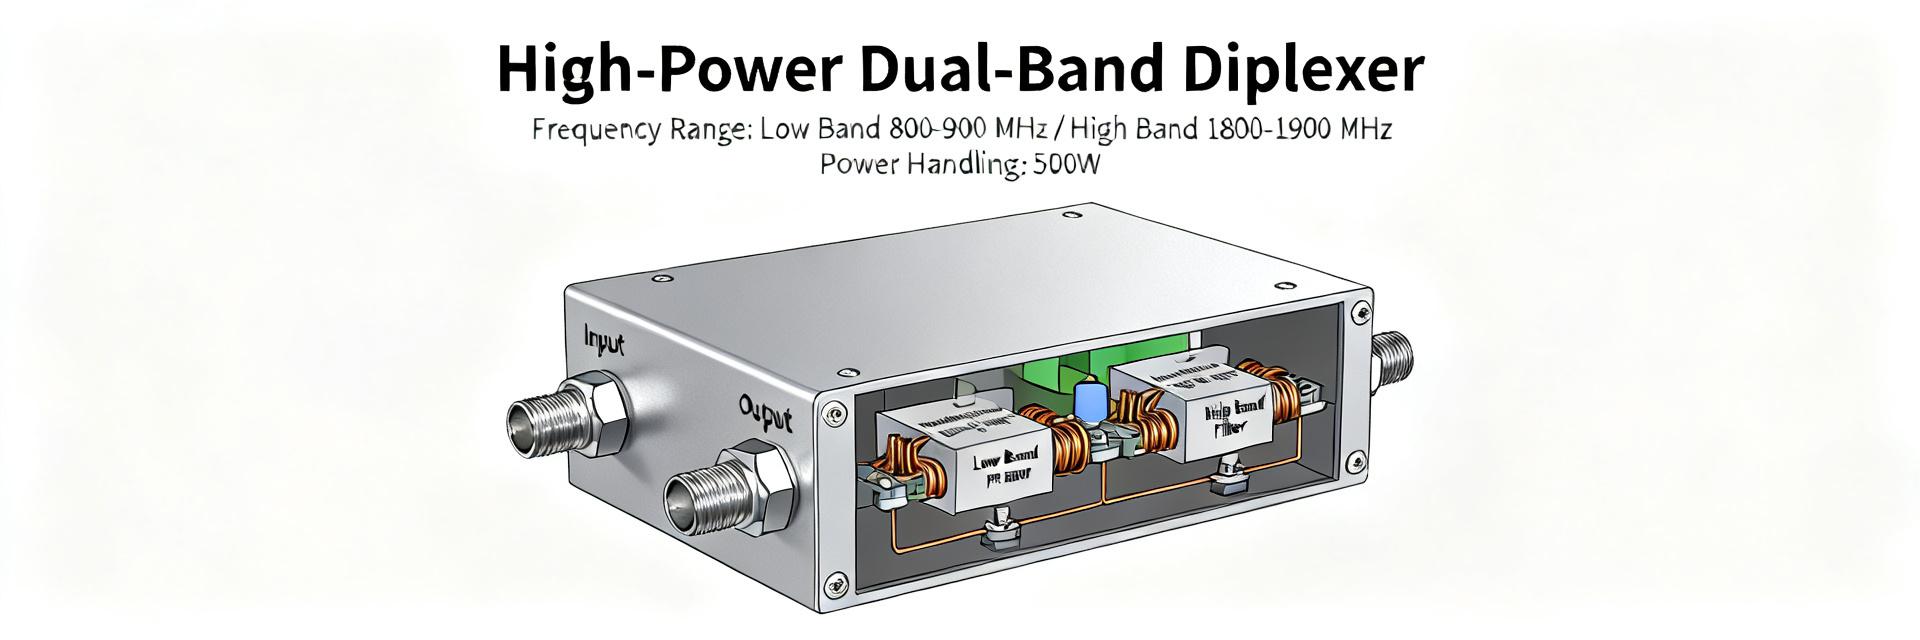
A high-power dual-band diplexer combines two band-selective filters into a single package optimized for elevated continuous or pulsed power. Key considerations include topology, materials, connectorization, and thermal management. For procurement and testing engineers the focus should be on measurable RF parameters, packaging robustness, and documented environmental ratings consistent with field use in US deployments.
Key RF parameters to evaluate
Evaluate insertion loss, isolation, return loss (VSWR), power handling (CW/pulse and P1dB), IMD/IP3, group delay, phase stability, and temperature coefficient. Insertion loss and isolation most directly affect link budget and receiver desensitization; P1dB and intermodulation govern linearity and compliance. Return loss and group delay affect matching and system timing. Prioritize guaranteed values over “typical” curves for mission‑critical systems.
Typical architectures and components
Common topologies include discrete LC networks for compact units, cavity or waveguide implementations for very high power, and tunable/lumped approaches for space-constrained applications. Materials (low-loss dielectrics, oxygen-free copper, high-grade RF gaskets) and connectors (flange vs. threaded) determine thermal path and VSWR under load. Choose architecture based on power density, bandwidth, and installation environment.
How to Read a Full Specs Sheet (Full Specs Breakdown)
Start with absolute maximum ratings, then RF performance tables, noting which values are guaranteed vs. typical. Verify test conditions: input power, modulation, pulse-width, reference impedance, and ambient temperature. Watch for environmental and aging clauses that limit warranty or specify de-rating. Where values are missing—request clarification and calibrated test traces before accepting samples.
Mandatory spec fields and how to interpret them
A complete spec sheet should list: absolute max input power, P1dB, IMD/IP3 at specified drive levels, insertion loss and isolation across both bands with frequency axes, return loss, and temperature coefficients. “Full specs” disclosure includes test conditions and measurement uncertainty. If a vendor provides only “typical” plots, require guaranteed min/max figures and calibration records for validation.
Practical spec acceptance criteria by application
Example pass/fail thresholds—macro base station: insertion loss ≤0.8–1.2 dB per band, isolation ≥35 dB; small cell: insertion loss ≤1.5 dB, isolation ≥30 dB; microwave backhaul: P1dB margin ≥3 dB above expected transmitter power, IMD third‑order products below regulatory limits. Use these as starting points and tighten for mission‑critical links.
Lab Test Methodology & Bench Setup (Data‑Driven)
Reliable measurement requires calibrated instrumentation and fixtures. Essential equipment: VNA with appropriate dynamic range, power meter and directional couplers, spectrum analyzer, calibrated loads, combiner fixtures, and thermal chamber for temperature stress. Ensure connector interface cleanliness and torque; use through‑calibration and port‑extension techniques to remove fixture effects from data.
Equipment, calibration, and test configuration
Calibrate VNAs with SOLT or TRL applicable to the frequency bands; validate power meter sensors against known standards. Map test ports explicitly for dual‑band measurements to avoid leakage paths. Use attenuators, preselectors, or input coupling to prevent receiver saturation when measuring isolation or IMD. Log calibration state and ambient conditions with each dataset.
Standardized test procedures to generate reliable data
Measure insertion loss with swept VNA at defined input power (low-power linear region), then measure power compression and P1dB with stepped CW/pulse power. Isolation and return loss require high-resolution sweeps and notch checks. For IMD/IP3, use two-tone tests with defined tone spacing and power levels. Repeat tests across temperature points and document sample size and standard deviation for reproducibility.
Representative Test Data: Reading and Interpreting Results
Key plots: insertion loss vs. frequency for both bands, isolation vs. frequency, return loss traces, power compression curves (dB vs. input), and thermal drift (center frequency shift vs. temperature). Annotate pass/fail limits and mark measurement uncertainty bands to aid comparison across vendors or lots.
Typical result plots and what they reveal
Insertion loss ripple indicates matching issues or resonances; isolation notches reveal coupling paths or filter detuning; shifted passbands suggest mechanical tolerance issues. Cross-plot P1dB and thermal rise to identify power‑limited designs. Visual inspection of traces against acceptance envelopes simplifies go/no‑go decisions in procurement.
Thermal, power and long‑term reliability data
Report temperature rise at rated power, P1dB under hot and cold conditions, and IMD growth with temperature. Use accelerated stress (e.g., elevated temperature and cyclic power) to observe drift; extrapolate MTBF conservatively using established acceleration models and documented failure modes. Include thermal imaging where possible to detect hotspots.
Common Failure Modes, Root Causes & Troubleshooting (Case Insights)
Electrical signatures: rising insertion loss often traces to lossy dielectrics, contact degradation, or contamination; isolation loss can indicate shifted coupling constants or mechanical stress. A diagnostic checklist—verify connectors, remeasure with alternate fixtures, sweep temperature and input power—quickly narrows root causes before disassembly.
Electrical failure signatures & likely causes
Examples: broad loss increase versus narrowband dips (bulk material vs. localized contact), sudden isolation collapse under power (thermal detune or arcing), spurious resonances (mechanical loose parts). Document and compare pre‑ and post‑stress spectra to pinpoint contributors and inform corrective action.
Mechanical and manufacturing issues to watch for
Watch connector torque and plating wear, solder joint cracks, housing seal failures that affect thermal paths, and tolerance stack-ups that shift band centers. Field checks—re-torque, clean contacts, and revalidate with a portable VNA—reduce NTF outcomes and speed failure resolution.
Design & Selection Checklist for Engineers (Actionable Procurement & Test Plan)
Checklist: confirm required bands and edges, insertion loss budget, minimum isolation, maximum input power and P1dB margin, size/weight/install constraints, and environmental ratings. Use long‑tail search phrases such as “high‑power diplexer specifications” and “dual‑band diplexer test data” when sourcing parts. For example, evaluate representative parts like SKY85907-88 during bench validation.
Spec-driven selection checklist
| Metric | Target (Macro) | Target (Small Cell) |
|---|---|---|
| Insertion Loss | ≤1.0 dB | ≤1.5 dB |
| Isolation | ≥35 dB | ≥30 dB |
| P1dB Margin | ≥3 dB above TX | ≥2 dB |
Test acceptance and procurement tips
Require lot sampling plans and baseline sample bench tests, lock specifications to guaranteed values (not typical), and mandate thermal imaging during high-power tests. For risk mitigation, claim contractual remedies for out-of-spec lots and request detailed test plots and calibration certification with deliveries—apply the same scrutiny to SKY85907-88 or any candidate part.
Summary
This practical, data-driven roadmap helps engineers read full specs and validate a high‑power dual‑band diplexer before procurement. The approach emphasizes guaranteed metrics, repeatable bench procedures, and thermal/power validation to ensure field reliability. One clear action: always require standardized bench tests and documented calibration records as part of acceptance for mission‑critical US deployments.
! Key Takeaways
- Prioritize guaranteed insertion loss and isolation values in the full specs; these govern link budget and receiver protection.
- Validate power handling with P1dB and IMD tests across temperature; thermal imaging reveals hotspots and de‑rating needs.
- Use standardized VNA and two‑tone procedures for reproducible results and require calibration records from vendors.
- Include contractual test requirements and lot sampling in procurement to avoid field failures and NTF scenarios.
Frequently Asked Questions
How should an engineer verify a diplexer’s power handling?
Measure P1dB and thermal rise using stepped CW and pulsed power while logging temperature and thermal images. Repeat at multiple ambient temperatures to reveal de-rating; require vendor charts showing P1dB vs. temperature and include a pass/fail margin in purchase contracts.
What are acceptable insertion loss and isolation targets for a dual‑band diplexer?
As a starting point: insertion loss ≤0.8–1.2 dB for macro sites and ≤1.5 dB for small cells; isolation ≥35 dB for high‑performance systems and ≥30 dB for less critical installations. Tune targets to link budget and regulatory constraints.
When is lab acceptance testing insufficient for diplexer qualification?
Lab tests may miss field stresses like vibration, salt fog, or long‑term thermal cycling. Complement bench data with accelerated environmental tests and sample field trials; require manufacturer aging data and calibration records for full qualification.


